
Edgium / Analytics and WAF logs
Analytics and WAF logs: how to read them and what to do
Analytics and the WAF logs show how your site is being delivered, whether a failure comes from your server or from the CDN, what the cache saves and what the protection stopped. This page explains each block and what to do with what you see.
All images were taken in a demo environment with fictitious data: example domains, documentation addresses and simulated traffic. The numbers illustrate how to read each screen and do not represent any customer. The panel is shown in its Portuguese interface; it is also available in English.
In this guide
- Analytics: the four questions
- Period, filters and shortcuts
- Summary: the five numbers
- Origin health: is it your server or the CDN?
- Error guide: what it means and what to do
- Origin speed and where the time goes
- Each origin (upstream)
- Paths with the most errors and the slowest paths
- What reaches your server the most
- Who accesses: countries, addresses and HTTPS
- Security blocks
- WAF logs: how to find, read and decide
Other panel guides:
- Panel guide: sign in, navigation and new subdomain
- Analytics and WAF logs: how to read them and what to do (this page)
- DNS: review, undo and history
Analytics: the four questions
Analytics answers, in the order they appear on the screen:
- How much was my site accessed and how was it delivered? (Summary)
- If something is slow or failing, is the problem my server or the CDN? (Origin health)
- Is the cache helping? (Traffic and cache)
- Who is accessing? (Countries, addresses, HTTP and HTTPS)
Two concepts help with reading. The origin (or upstream) is your server, where the CDN fetches whatever is not cached yet. The cache is the copy the CDN keeps to deliver faster: the more requests come from the cache, the less work your server does.
Period, filters and shortcuts
At the top of the screen you choose the period (6 hours, 24 hours, 7 days or 30 days) and refine it with + Filter. Filters become removable tags, and the page address keeps your choices: you can copy the link and send it to a colleague.
Available filters: status (for example 502, 5xx, 404 or 4xx), path (part of the page address), country and IP, among others. Clicking a country, IP, path or server inside the charts also applies the filter.
The shortcuts leave the screen ready for the most common questions:
| Shortcut | What it is for |
|---|---|
| Only 5xx errors | Shows only the requests that failed on the server side. |
| Only slow (1 s or more) | Shows only what took one second or more. Great for finding the page that weighs. |
| Blocked by the WAF | Shows only what the protection stopped. |
| IP with most requests | Shows who accesses the most, to tell ordinary visitors from bots. |
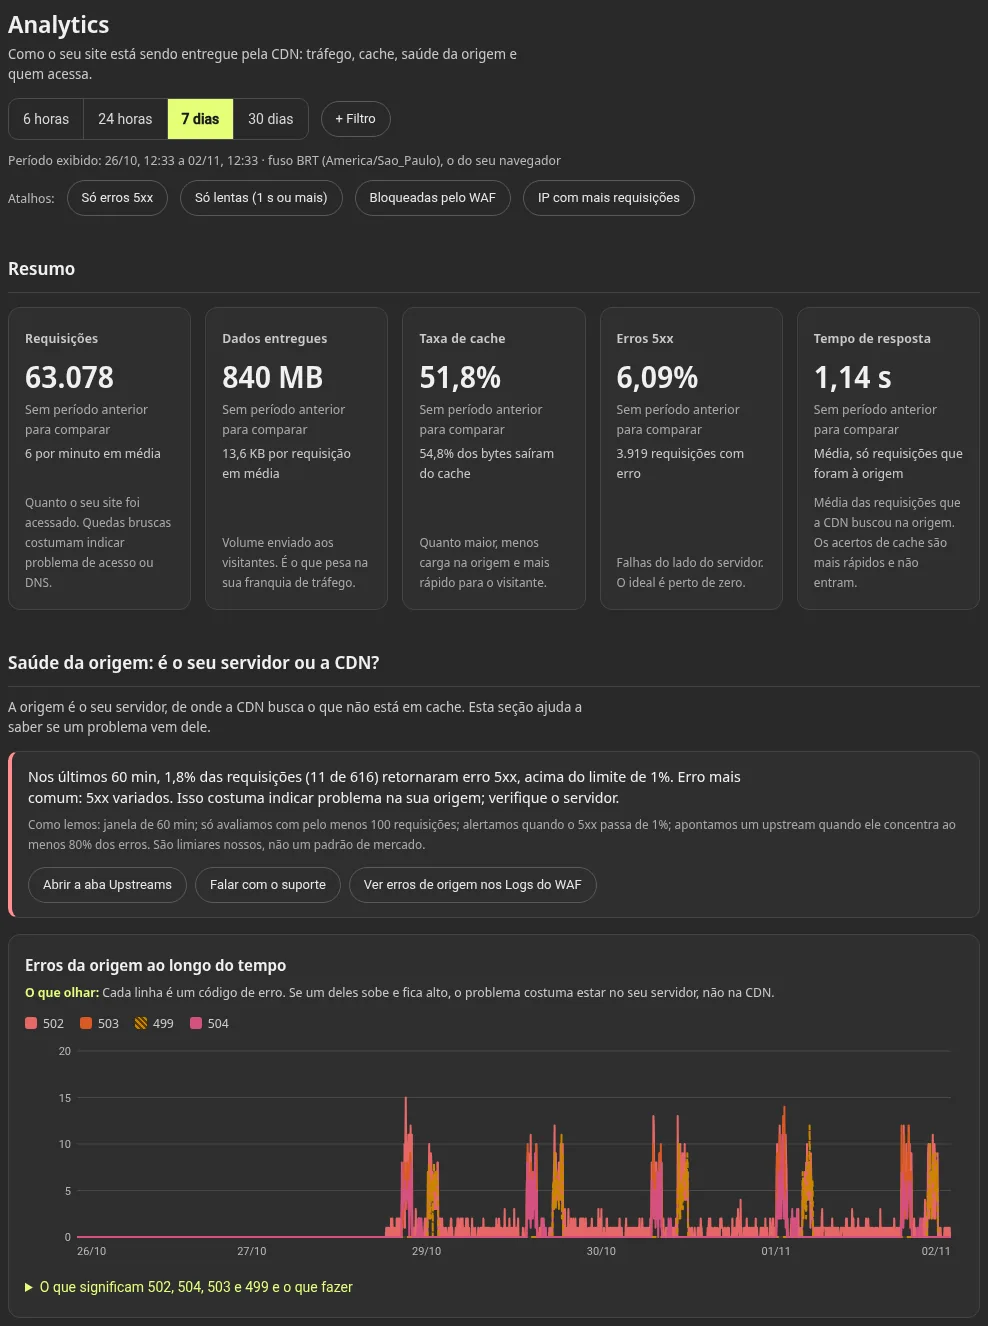
Only slow: the shortcut filters requests of 1 second or more. The whole Summary then speaks only about those requests, so "Response time" shows how long they take, not the general average.
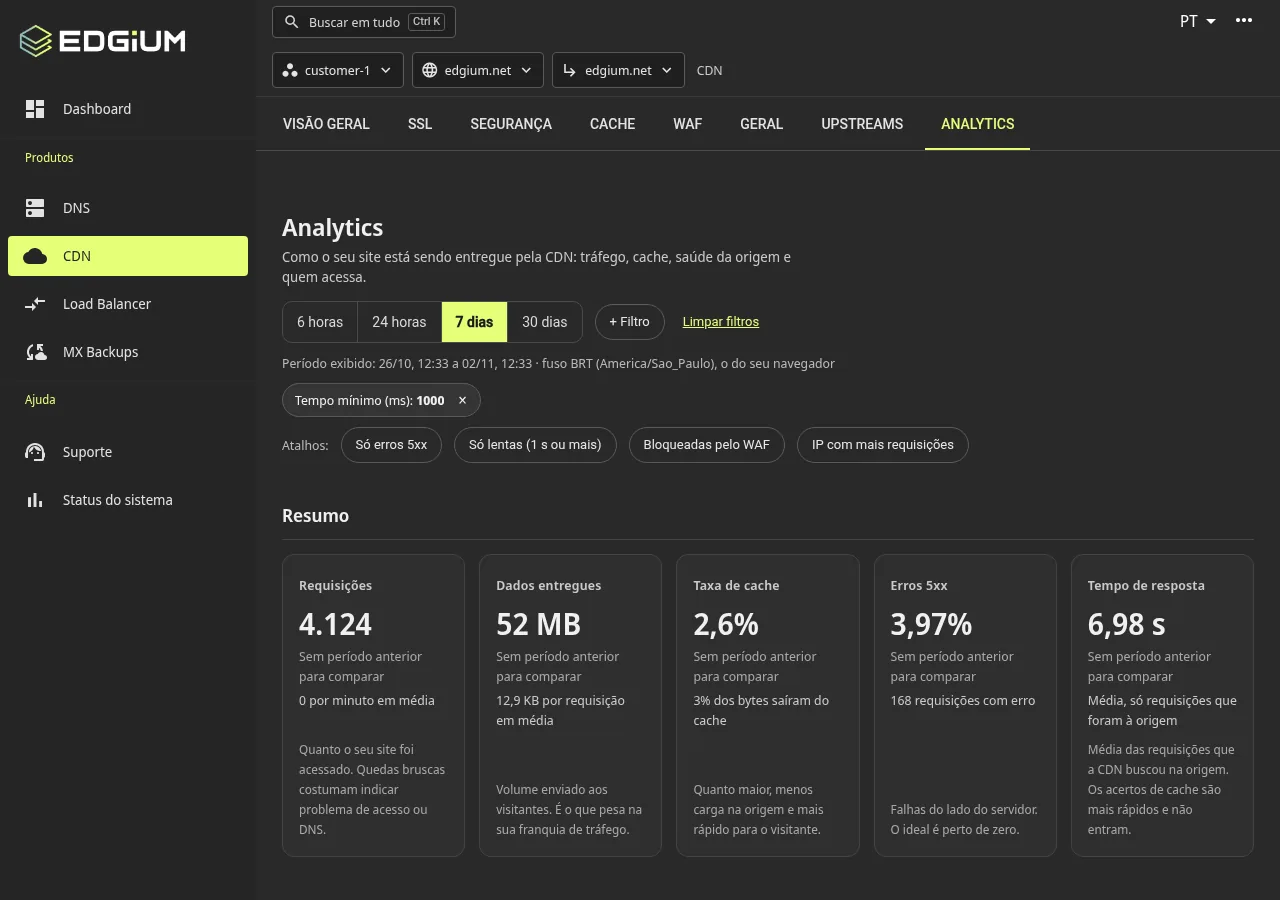
Blocked by the WAF: the same applies here. All numbers now describe only what was blocked, which helps you see the volume and size of that traffic.
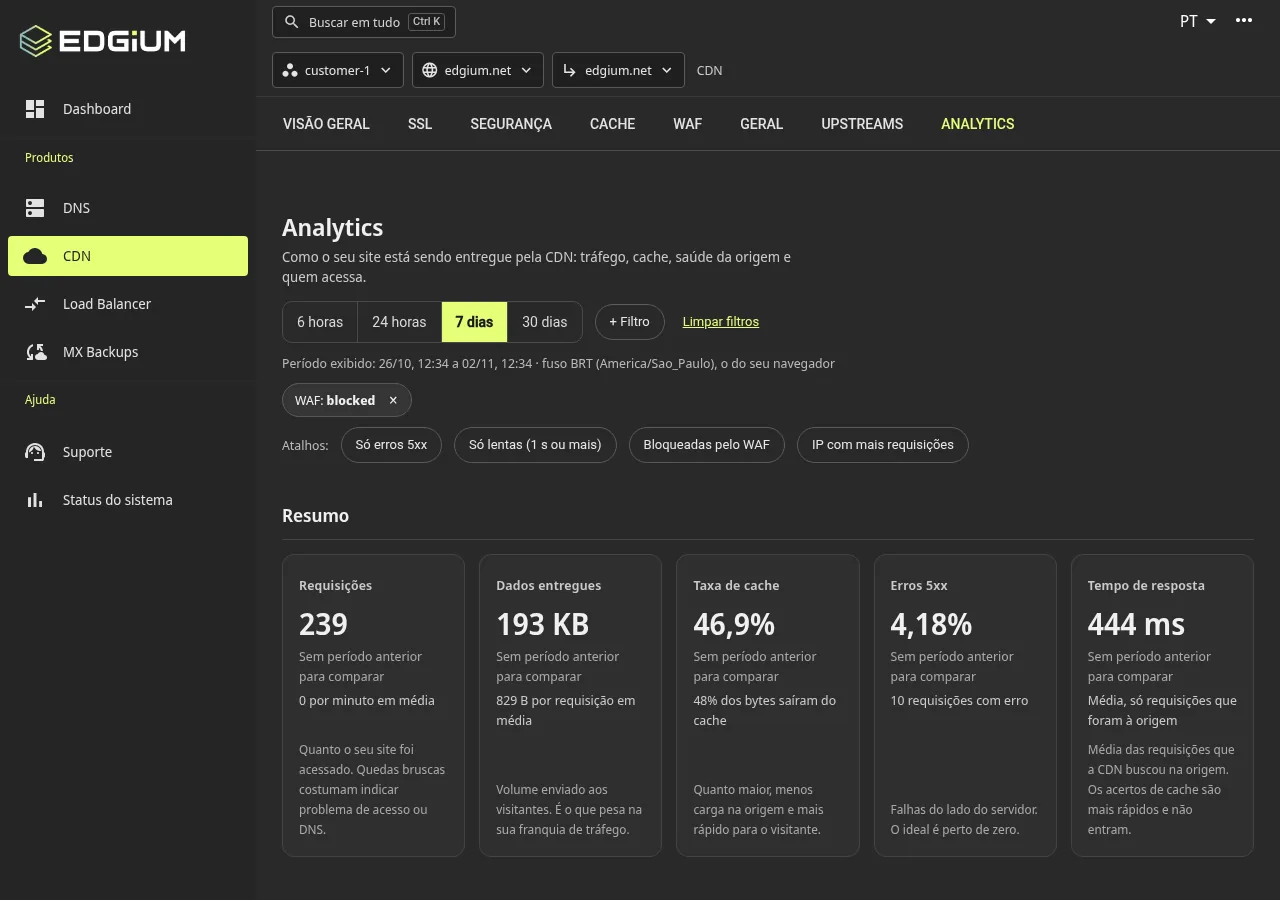
Summary: the five numbers
| Card | What it means | How to read it |
|---|---|---|
| Requests | How many times your site was accessed. | A sharp drop usually points to an access or DNS problem. A sudden rise may be a campaign or a bot. |
| Data delivered | Volume sent to visitors. | This is what counts against your traffic allowance. |
| Cache rate | Percentage of the data that came from the cache. | The higher it is, the less load on your server and the faster for the visitor. |
| 5xx errors | Percentage of requests that failed on the server side. | Ideally close to zero. |
| Response time | Average of the requests the CDN had to fetch from your origin. | Whatever comes from the cache is fast and is not in this average. |
Each card compares with the previous period and carries a "what to look at" line.
Origin health: is it your server or the CDN?
This is the most useful part when something looks wrong. At the top of the section there is a diagnosis sentence for the last 60 minutes, for example:
"In the last 60 min, 1.8% of requests (11 of 616) returned a 5xx error, above the 1% limit. This usually points to a problem on your origin; check the server."
How we read these numbers: the window is 60 minutes; we only evaluate when there are at least 100 requests, so the math is not misleading with few visits; we alert when 5xx errors pass 1%; and we point to a specific origin when it concentrates 80% or more of the errors. The criteria appear on the screen itself.
Below the sentence there are useful buttons: Open the Upstreams tab, Talk to support and See origin errors in the WAF logs.
Errors over time: 502, 503, 504 and 499
The chart shows one line per error type. Read it like this: if a line rises and stays high, the problem is usually on the origin server, not on the CDN. Peaks that repeat at the same time point to a scheduled job, a backup or a traffic peak the server cannot handle. Click "What 502, 504, 503 and 499 mean and what to do" to open the explanation inside the screen.
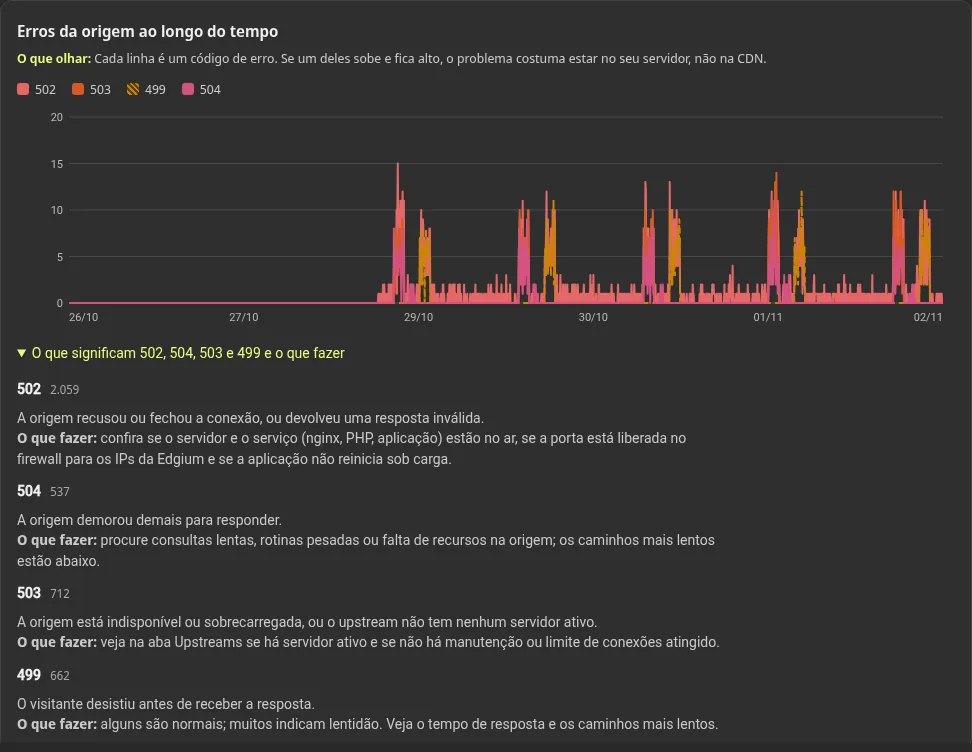
Error guide: what it means and what to do
5xx errors: failure on the server side
They always deserve attention.
| Code | What happened | What to do |
|---|---|---|
| 502 | The CDN tried to talk to your server and it refused, closed the connection or returned an invalid response. | Check that the server and the site service are up, that the port is open in the server firewall for Edgium, and that the application does not restart under load. |
| 503 | The server is unavailable or overloaded, or the CDN found no active origin to serve the request. | Open the Upstreams tab and check that there is an active origin. Also check for maintenance in progress or a connection limit reached. |
| 504 | The server took too long to answer. | Look for slow queries, heavy jobs or lack of resources (memory, CPU). Use "Slowest paths" to find the page responsible. |
499: the visitor gave up
It is not a server or CDN error: the person closed the page, switched screens or lost the connection before receiving the response. Some are normal. Many 499s point to slowness: the visitor got tired of waiting. Look at the response time and the slowest paths.
4xx errors: something about the request
They usually do not mean a server that is down, but what was requested. To investigate, use the Status filter with 4xx (or a specific code) and look at the paths and the list of recent requests.
| Code | Usual meaning | What to do |
|---|---|---|
| 400 | Malformed request. | If it is very frequent and comes from a single IP, it may be a bot. If it comes from visitors, check forms and integrations. |
| 401 and 403 | Unauthorized or forbidden access. | Check whether the page requires login and whether a block on your site or in the WAF is stopping people it should not (see the WAF logs). |
| 404 | Page not found. | Many 404s on pages that should exist point to broken links or an address change without a redirect. Many 404s on odd paths are usually bots looking for flaws, which is generally harmless. |
| 429 | Too many requests in a short time. | Usually the rate limit of your own site or of an integration that insists too much. |
Tip: compare 4xx and 5xx. If the 5xx rise together with slowness, focus on the server. If only the 4xx rise, focus on what is being requested: links, bots, integrations.
Origin speed and where the time goes
- Origin speed shows three measures: p50 (the typical time: half of the requests are faster than this), p95 (95% of requests are faster than this) and p99 (the slowest cases). If p95 and p99 rise while p50 stays steady, a few requests are slow, usually one specific page or query.
- Where the time goes splits the wait into connection to the origin, processing and sending the response. High connection time points to a saturated network or server. High processing points to the application. High sending shows up with large responses or limited bandwidth.
Each origin (upstream)
The table compares your origins side by side: requests, 5xx errors, 502, 503, 504, 499, error rate, retries and p50, p95 and p99 times. Read it like this: an origin with a high error rate while the others are clean is the one that needs attention. Retries mean the CDN had to try another origin to complete the request.
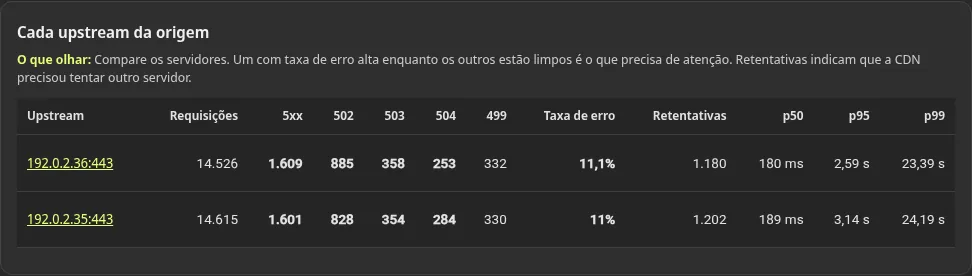
Right below, Connections dropped by the origin summarizes the failures when talking to your server: connection refused, closed midway, reset, timed out or no active origin. They usually point to a server restarting, out of free processes or blocked by a firewall.
Paths with the most errors and the slowest paths
- Paths with the most 5xx errors: start here. It is usually one page, one API route or one specific query. Click to filter.
- Slowest paths: sorted by p95 time. They are good candidates to optimize on the server or to put in cache.
Paths are grouped to make reading easier: for example, /products/:n stands for all product pages.
What reaches your server the most
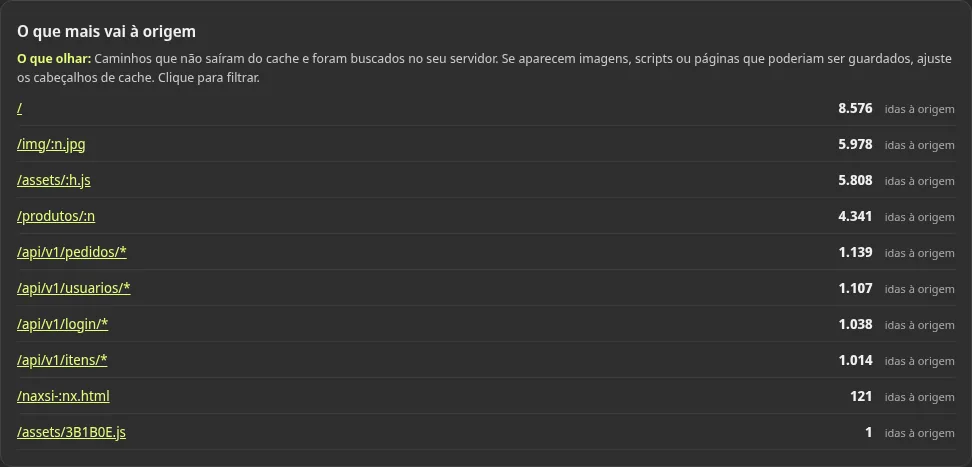
The list shows the pages and files that did not come from the cache and were fetched from your server. It is one of the fastest ways to gain performance: if images, scripts or pages that could be cached show up, adjust your site cache headers (or the cache time on the Cache tab) so the CDN starts keeping them.
Who accesses: countries, addresses and HTTPS
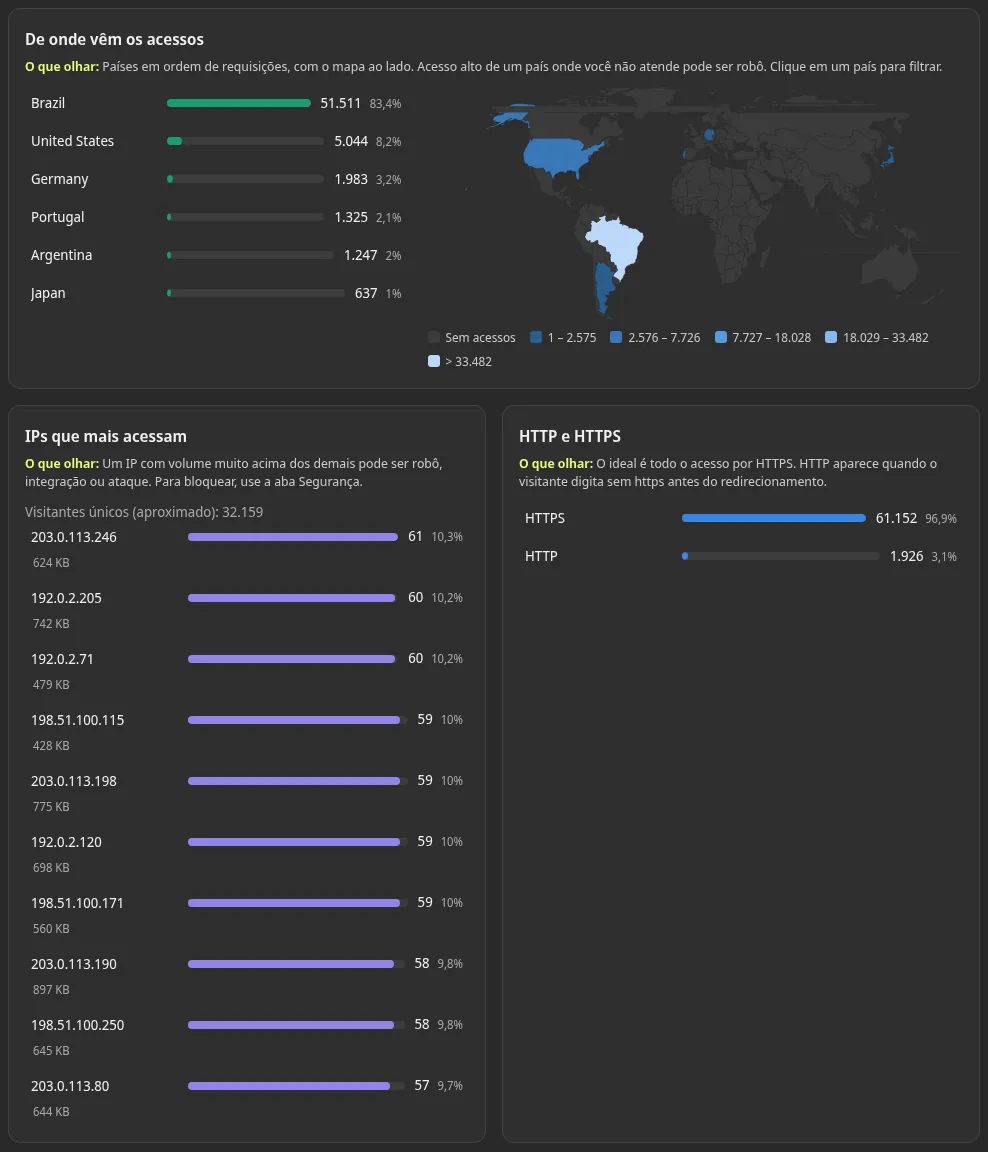
- Where visits come from: countries in order of requests, with the map beside them. Lots of traffic from a country where you do not operate may be bots. Click a country to filter.
- IPs that access the most: an IP with a volume far above the rest may be a bot, an integration or an attack. The list also shows the approximate number of unique visitors.
- HTTP and HTTPS: ideally all access is over HTTPS. HTTP shows up when the visitor types the address without
httpsbefore the redirect.
Security blocks inside Analytics
The Security blocks block counts how many requests the WAF stopped, how many events were only logged in learning mode (without blocking) and how many connections were closed without a response (444). If there is a peak outside the pattern, it may be an attack. To understand what was stopped, open the WAF logs with the button beside it.
WAF logs: how to find, read and decide
The WAF is the protection that inspects every request to your site and stops what looks like an attack, such as attempts to inject commands into forms. The WAF logs show what was stopped and why. To get there, use the WAF logs button on the CDN home screen or, inside Analytics, the Open WAF logs button.
How to find a block
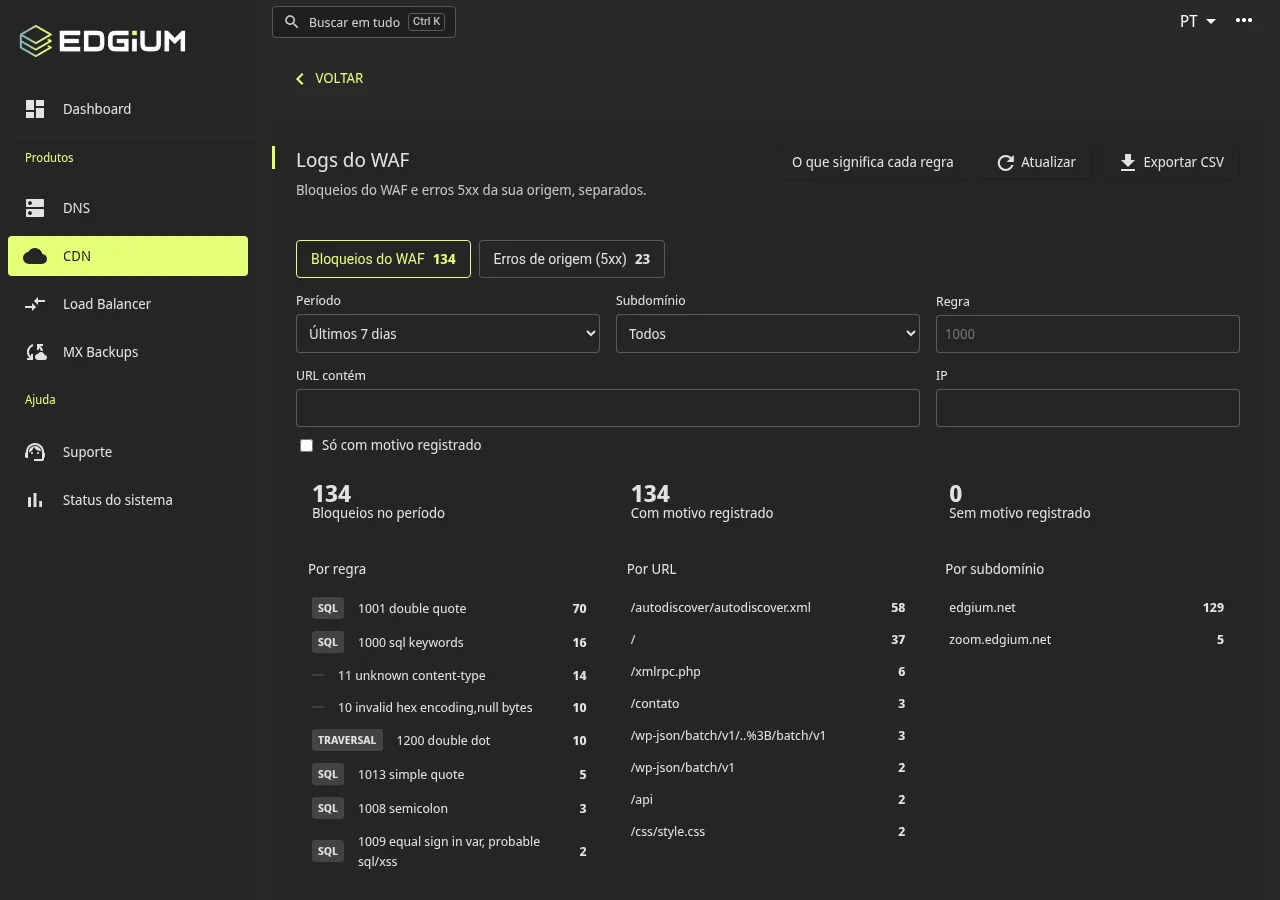
There are two tabs: WAF blocks (what the protection stopped) and Origin errors (5xx) (failures of your server, kept apart so they do not mix with the blocks). The filters take you to what matters:
- Period: from a few hours to a few days.
- Subdomain: a specific one or all.
- Rule: the rule number.
- URL contains and IP: for when you already know which page or visitor you are looking for.
- Only with a recorded reason: shows only the records with detail.
At the top there is a summary with the blocks in the period, how many have a recorded reason and how many do not. Then come the rankings By rule, By URL and By subdomain: if one rule or page dominates the ranking, start there. You can export the list as CSV.
How to read the reason and the rule
Each row shows time, subdomain, requested address, reason (the rule category) and the full visitor IP. Click a row to see the detail:
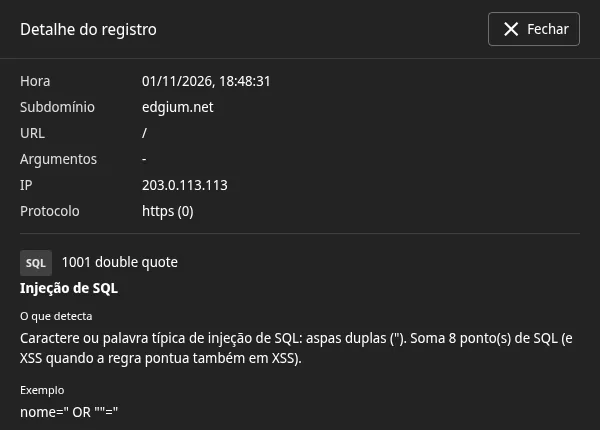
- Rule number and name (for example, "1001 double quote"): identifies what was detected.
- What it detects: an explanation in Portuguese of the pattern that triggered the rule.
- Example: a typical snippet of what the rule looks for.
- Further down, the panel guides you on what to check on your site.
The What each rule means button opens the full catalog of rules. The most common categories:
| Category | What the rule looks for |
|---|---|
| SQL | Typical snippets of attempts to tamper with your site database through forms and addresses. |
| XSS | Attempts to inject scripts into your pages. |
| TRAVERSAL | Attempts to leave the site folder to read other files, for example with ../ sequences. |
| WAF (general) | Malformed or out-of-standard requests, such as unknown data format and invalid characters. |
How to decide: attack or legitimate use?
Ask three questions when you see a block:
- Is the URL from my site? Paths you do not recognize, such as
/xmlrpc.phpon a site that does not use that technology or/.git/config, are bot scans. The block is correct and there is nothing to do. - Does the request come from a real feature of my site? If the address is yours and the block hits a form, a text editor or an integration you use, note the URL, the rule and the IP and talk to us. The team adjusts the rule safely.
- How many IPs and how often? Many attempts from the same IP in a row are a scan. A single isolated block on an address of yours, from a real visitor, deserves a look.
Learning mode: on the subdomain WAF tab, learning mode records what would be blocked without blocking anything. It is a safe way to test before protecting. The events of this mode show up in Analytics apart from the blocks.
Frequently asked questions
What does a 502 error mean in Analytics?
The CDN tried to talk to your server and it refused, closed the connection or returned an invalid response. Check that the server and the site service are up, that the port is open in the firewall for Edgium and that the application does not restart under load.
What does a 504 error mean?
Your server took too long to answer. Look for slow queries, heavy jobs or lack of resources, and use the slowest paths list to find the page responsible.
What does a 503 error mean?
The server is unavailable or overloaded, or the CDN found no active origin. Open the Upstreams tab and check that there is an active origin.
What is a 499?
The visitor gave up: closed the page, switched screens or lost the connection before receiving the response. Many 499s point to slowness.
How do I know if the problem is my server or the CDN?
The Origin health section of Analytics evaluates the last 60 minutes and warns when 5xx errors pass 1%, pointing to the origin that concentrates most of them.
How can I tell if a WAF block was an attack?
Check whether the URL is from your site, whether the request comes from a real feature and how many IPs and how often. Paths you do not recognize and many attempts from the same IP are bot scans.
No panel account yet?
Accounts are created by the Edgium team. Tell us your domain and we will prepare your access and a trial with your site.